The entire TimingCube Staff expresses its gratitude
for the privilege of serving you during 2011 and
wishes you Happy Holidays
and a Healthy and Prosperous
YEAR
|
Schedule note:
U.S. Stock markets will closed on Monday, December 26 and Monday January 2, 2012 in observance of Christmas and New Year's Day respectively.
|
Current Signal Performance |
|
|
Turbo Signal
|
Trade Date
|
Turbo Model Returns (Long & Short Strategy)
|
|
|
|
|
Nasdaq 100
(QQQ)
|
Russell 2000
(IWM)
|
S&P 500
(SPY)
|
|
|
|
|
|
Classic Signal
|
Trade Date
|
Classic Model Returns (Long & Short Strategy)
|
|
|
|
World
|
Nasdaq 100
(QQQ)
|
Russell 2000
(IWM)
|
S&P 500
(SPY)
|
|
|
|
|
|
Stock investors continued to view the Euroglass as half-empty Monday in broad-based, though light volume, selling. Indexes notched a -1% drift to continue the prior week's dour mood. Improvement in Spanish and Italian bond auctions coupled with better housing data in the U.S. to launch stocks on a torrid rally Tuesday sending markets up around +3%. Wednesday's digestion of that move was complicated by two major pieces of news. The ECB opened the proverbial teller window Wednesday finding over 500 banks queued up for funding injections. The good news being that the ECB showed more commitment to helping prevent further liquidity crises by making the money available; the bad news being that so many banks appear to need help. European stocks, at least for Wednesday, seemed to lean toward a slightly negative view of the event. Domestically, investors pondered that Euro news while anything computer-related got whacked in sympathy with a very weak earnings report from Oracle. The tech bellweather suffered a >10% hit on the news. However, defensive stocks and financials buoyed the rest of the market allowing the non-tech indexes to find breakeven by day's end. A slightly better jobless claims number kept stocks moving in a positive direction Thursday, leaving indexes up fractionally while crude oil marched back toward the $100 per barrell mark, reversing from the prior week's selloff. Keeping gains in check perhaps was a downward revision to the Q3 GDP number to 1.8% - the initial print had been 2.5%. Friday's light pre-holiday trading was influenced by mixed economic data. Still, the DJIA was able to clear its October highs to end the week with a decidely bullish tone.
Continuing the choppiness of the past few weeks, indexes reversed the prior week's losses. The S&P 500 (SPY) added +3.95% to more than recoup the last week's poor showing. The Russell 2000 small-cap index (IWM) ticked higher by +3.67%. The Nasdaq 100 (QQQ) was a relative laggard moving higher by +2.22% as the one-day Oracle-fueled decline hurt the index. The S&P 500 climbed back above its 200-day EMAs while the Nasdaq 100 stopped its advance exactly at its simple 200-day moving average.
The top 5 World ETF portfolio gained +3.49% this week. With the Classic Model on a Sell signal, the World approach calls for staying in cash if you follow
the "Long Only" methodology, or taking a short Nasdaq 100 (QQQ)
position if the "Long and Short" strategy is your guide. Only "Buy and Rebalance" followers should be invested in
the World portfolio at this time. Go to the Classic Model "Description"
page for a more detailed explanation of the strategy choices.
Our Turbo Model remains on a Buy signal while Classic continues to be a Sell.
Sector leadership offers clues to what large investors
are thinking
Our Models are built on price and volume data; based on how
the markets move rather than on any fundamental economic analysis
or input. We expect that the behavior of investors through their
willingness, or lack thereof, to buy stocks in a broad way is most
key to discerning the future direction of stocks. Thus, we end up
making a "market call" short-term with Turbo and intermediate-term
with Classic. We invest accordingly.
Of course there are plenty of other ways to dissect markets and
investor behaviors. Beyond the swings and sways of index prices,
we like to ponder sector leadership as another market "tell".
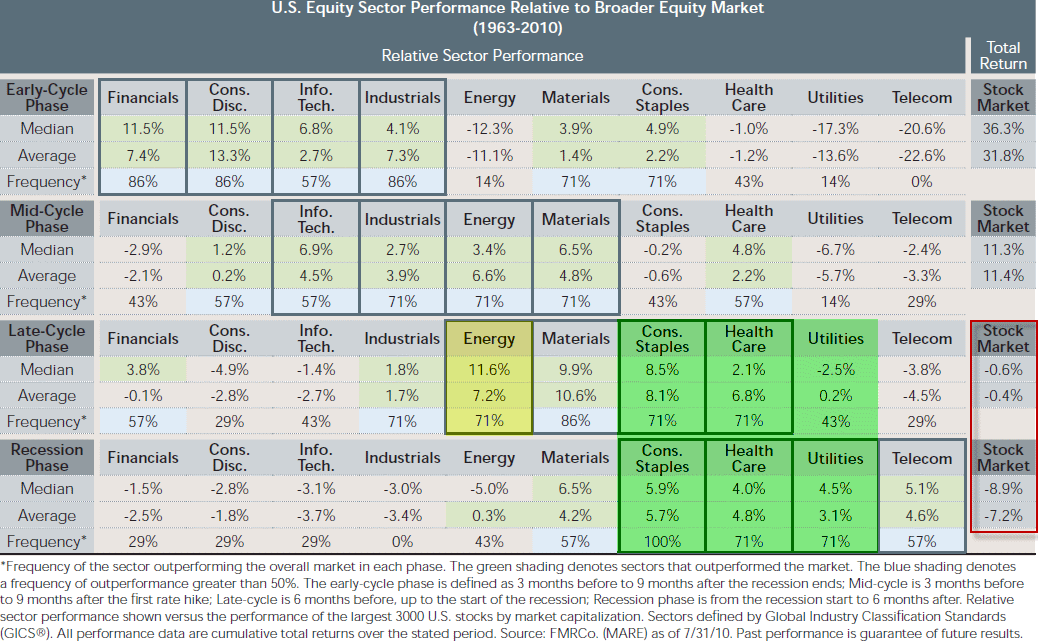
Fidelity Investments has a nice little cheatsheet on sector rotation
that we offer in today's weekly. Let's start by spelling out what
we are looking at in this table of data. This roadmap offers four
stages of the economic cycle, from early cycle when investors sense
the end of the recession is imminent, through the expansion phase
(termed mid-cycle in this analysis), to a late cycle period when
the expansion is running out of steam, and on into the next recessionary
phase. Considered as one full cycle, stocks offer their biggest
and broadest gains at the beginning dropping into losses as the
next recession comes round - see the far right side of the table
for the broad market averages through each phase. During each phase
of the cycle, market leadership is shared by different groups, with
cyclicals naturally showing big returns as the economy expands,
and defensives taking over as the economy slows down. Here is a
snapshot of the table with a couple of key data elements identified:
Chart 1: Sector rotation data gives us a handy roadmap

Chart 2: The stock market's move through sectors as economy
ebbs and flows

While the data presented in the table encompasses nearly fifty years,
we recognize that each economic cycle brings its own flavor causing
some sectors to perform better or worse than the historical averages.
Currently, financial stocks are not what they have been in the past,
struggling with multiple lingering burdens from the housing finance
crisis, the need to rebuild their capital base, and the Eurodebt
overhang. At times, energy stocks have been the beneficiaries of
tight demand-supply metrics, most recently as China has emerged
as a larger mouth to feed on the global resource stage. This year,
the strength of consumer discretionary stocks would seem at odds
with the recessionary tilt of the shift into defensives. Institutional
investors know well this sector rotation playbook. Thus, the movement
of funds between these sectors gives us an indication where market
participants, in aggregate, view the economy heading. To be sure,
there are occasional fakeouts as all economic data is subject to
out-of-range blips and one-off readings.
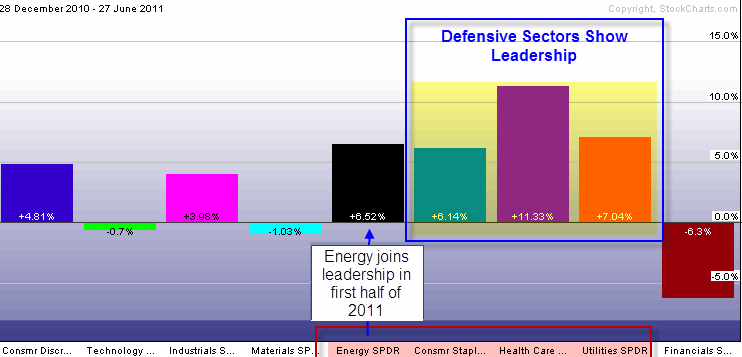
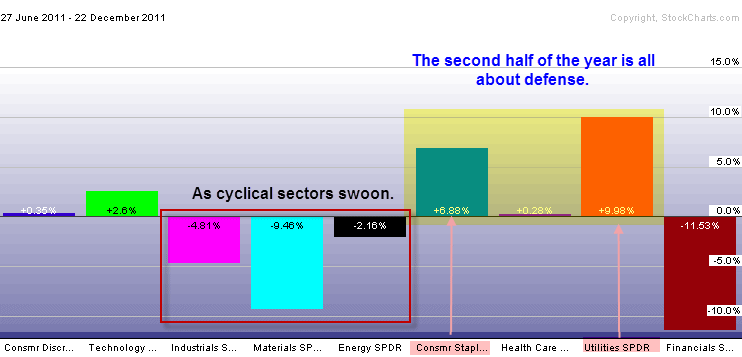
Chart 3 and 4: 2011 sector rotation shows
investors playing a recessionary theme


Through the first half of 2011, energy stocks were the market's
leading lights as oil prices marched upward. By summer, the bear's
claws flashed anew, energy stocks fell in the tank with the rest
of the market, leaving defensive sectors standing almost alone (consumer
discretionary stocks stubbornly hanging on also). Through the second
half of the year, defensives have ruled the roost concluding this
week with breakouts among defensive consumer staples and utilities
with strong performance from the other traditional defense sector
- healthcare. With the year drawing to an end, we can compare the
market's behavior with the sector rotation table. For one, the broad
market looks to end up somewhere near flat on the year, consistent
with the late-cycle phase in the table. However, the sector behavior
of recent months is a little more consistent with the recession
phase. We have stated before that our understanding of the past
100+ years of stock market cycles suggests a very high likelihood
that stocks will suffer a losing year in 2012, especially if 2011
ends up positive - we note this is consistent with the recessionary
phase in the table. With a smell of recession coming from European
economic data, a slowdown in China becoming more apparent, and the
U.S. continuing to find growth modest at best, the market's read
jives with fundamentals.
As "right" as that may seem today, we expect that defensive
sectors - this year's star performers in the stock market - will
pass that baton back to more cyclical sectors at some point. Like
scouts scanning the horizon, investors will see a brighter future
ahead and will begin deploying their assets accordingly, well before
the data shows up. Markets will lean upward, our signals will align
on a Buy, and we will be off to the races - at least for a little
while.
Question: How do I buy "at the open"?
Anyone who has dug into our signal history may have noticed that all
the pricing behind our results assumes that we buy or sell "at
the open." But what does that really mean and how does one get
this "open" price? To buy or sell at the open just means
that we are assuming we get the "open" price, or the price
at which the security is said to begin trading on a given day. To
get this price in your trading, you can place orders anytime before
the regular opening of market hours - e.g. 9:30 in New York. All orders
placed before the bell is rung will get the price shown as the Open
price. You don't have to be sitting in front of your computer exactly
at 9:30 EST to get this price, in other words. You want to make sure
you are not asking the broker to trade in the "pre-market"
or "after-hours". If you have any questions, or want to
be sure, ask your broker how you achieve the open price for the day.
It should resemble what we're saying here - place trades sometime
in the morning, before the market opens. We use the open price because
it is a well-documented price and anyone can achieve it through their
trading (unlike some services which might make assumptions about getting
a trade executed at a high or low price for the day, which may or
may not be realistic or feasible). .
Warm wishes and until next week.
The TimingCube
Staff
|
|