|
Current
Signal Performance |
|
|
Turbo Signal
|
Trade Date
|
Turbo Model Returns (Long & Short Strategy)
|
|
|
|
|
Nasdaq 100
(QQQ)
|
Russell 2000
(IWM)
|
S&P 500
(SPY)
|
|
|
|
|
|
Classic Signal
|
Trade Date
|
Classic Model Returns (Long & Short Strategy)
|
|
|
|
World
|
Nasdaq 100
(QQQ)
|
Russell 2000
(IWM)
|
S&P 500
(SPY)
|
|
|
|
|
|
Investors pivoted from watching the Fed to eyeing the Congressional standoff over the budget. Trade was quiet, cautious, and lethargic throughout the week. Monday saw fractional losses for stocks despite a near +5% pop in share of Apple (AAPL) on news of strong early demand for the newest iPhone. Continuing gains in home prices offset another lawsuit aimed at JP Morgan (JPM) to keep stocks flat Tuesday though the S&P 500 gave up 1700 in its fourth straight losing session. That trend added a fifth fractionally down day in a quiet Wednesday with little news to spur investors to change their positions. Stocks broke the losing streak Thursday with leading biotech and internet sectors pushing the Nasdaq to a +0.7% gain. Still, the S&P 500 failed once again to hold above 1700. Investors remained cautious in Friday's trade while Congress continued its back-and-forth over the budget, which will feed into a debt ceiling debate in short order. New Dow Industrials member, Nike (NKE), was a bright spot rising +4% on strong earnings.
For the week, the S&P 500 (SPY) fell four of five days in quiet trading while investors await Congress getting past their latest manufactured crisis. The S&P 500 gave back -1.06% for the week. However, the nominally higher-risk small-cap Russell 2000 (IWM) and Nasdaq 100 (QQQ) managed a flat week with changes of +0.25% and +0.14%, respectively. Our World Portfolio also found its way to a breakeven week with a +0.13% return.
Both Classic and Turbo continue on Buy signals.
Do markets accurately reflect the economy
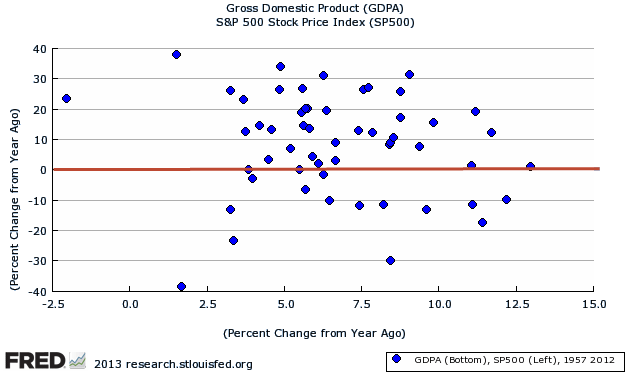
Investors hang on every monthly economic report as if that data is a key driver of the stock market. But is it? Do markets really mirror the ups and downs of the economy? Chart 1 below plots annual stock market returns against economic growth. The horizontal line is set at a stock market return of 0%, so points below are negative years for stocks. You can easily see there are a number of negative years for stocks. Negative years for the economy are on the far left of the chart. There are very few dots over there. The economy almost always grows and rarely contracts while stock markets show a yearly decline about one out of every four to five years.
Chart 1: Stock market returns versus GDP

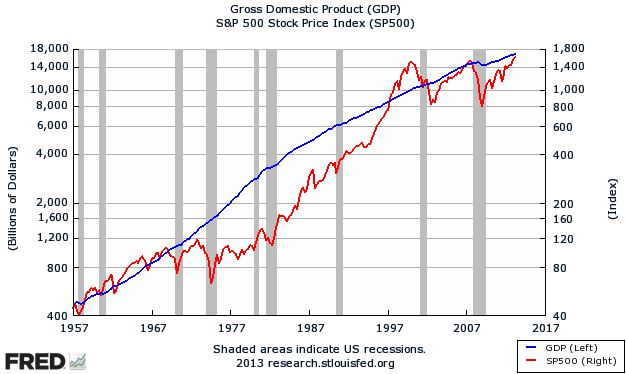
Chart 2 shows a different view but the message is the same. The economy tends to grow with few exceptions, shown below as a very smooth blue line, while stocks bounce around occasionally spending years "off-track" and out of sync with economic growth.
Chart 2: Long-term view of stocks versus economy

A couple of factors are at play here. First, investors are looking forward, trying to read the future. They reflect that collective view of the future in the prices of stocks. And they are often wrong. Investors overplay the negative and ignore the positive when emerging from a weak period. Similarly, in a bullish phase, investors see the world through rose-colored glasses, overlooking the bumps in the road ahead. Investors are emotional beings with a strong bias toward acting as a group. For a recent example, just look back to December of last year as markets overpriced the likelihood of a "fiscal cliff" disaster. Few investors were stepping up to buy that opportunity fearing the downside more than worrying about missing the upside potential.
We will let our readers ponder what the above charts mean for all the investors that comb through economic reports building a fundamental view of the world on which to base their investment thesis. The market has been going up without any notable pause all year. No one foresaw that. There was a long list of reasons for stock investors to sell rather than buy. Our Models prefer to focus on the actual movement of stock prices for clues as to what happens next.
Question:
What is the expiration/renewal date for my subscription?
For convenience, and to avoid any unwanted interruption of service,
all of our subscriptions are automatically renewed at the end
of each paid period, unless cancelled before. You can check
your scheduled renewal (or expiration) date at any time. To
do so, go to the "My Profile" page
after you log in to the site and click on the button "Click
here to see the Current Status of My Subscription"
located at the top of the page. This will display your current
subscription status, including the type of plan you are on (e.g.
monthly or yearly) as well as the scheduled renewal/expiration
date.
Warm wishes and until next week.
TheTimingCube Staff
|